
Website speed optimization
- Price
- from $2,000
- Timeline
- 2–4 weeks
- Experience
- 100+ projects · 10+ years · 9+ countries
We get your website to 90+ on Google PageSpeed and green Core Web Vitals without losing the design or animations
- PageSpeed Insights
- Lighthouse
- WordPress
- Nuxt
- Cloudflare
Our usual stack. We bring in other tools when the task or the project calls for it.
Your Google PageSpeed score and Core Web Vitals decide how many visitors wait for the first screen and how high search ranks the site. Most of the time it’s not the server or the CMS that slows a website down but what the page loads: uncompressed images, full font files, third-party scripts and heavy animations.
We find the exact causes, fix them on your current platform and prove the result with measurements. For a typical website our target is 90+ on PageSpeed on both mobile and desktop.
What’s included
- PageSpeed Insights and Lighthouse runs for key pages
- Core Web Vitals field data: LCP, INP and CLS of real visitors
- AVIF and WebP images at the right size, lazy-loaded
- Fonts: subsets, preloading and no text jumps
- Scripts: cutting what’s unused, deferring trackers and widgets
- Server caching, compression, HTTP/2 and CDN
What you get
- A report with before and after measurements for every page
- The same design and animations, only faster
- A list of what was done and how to stay fast
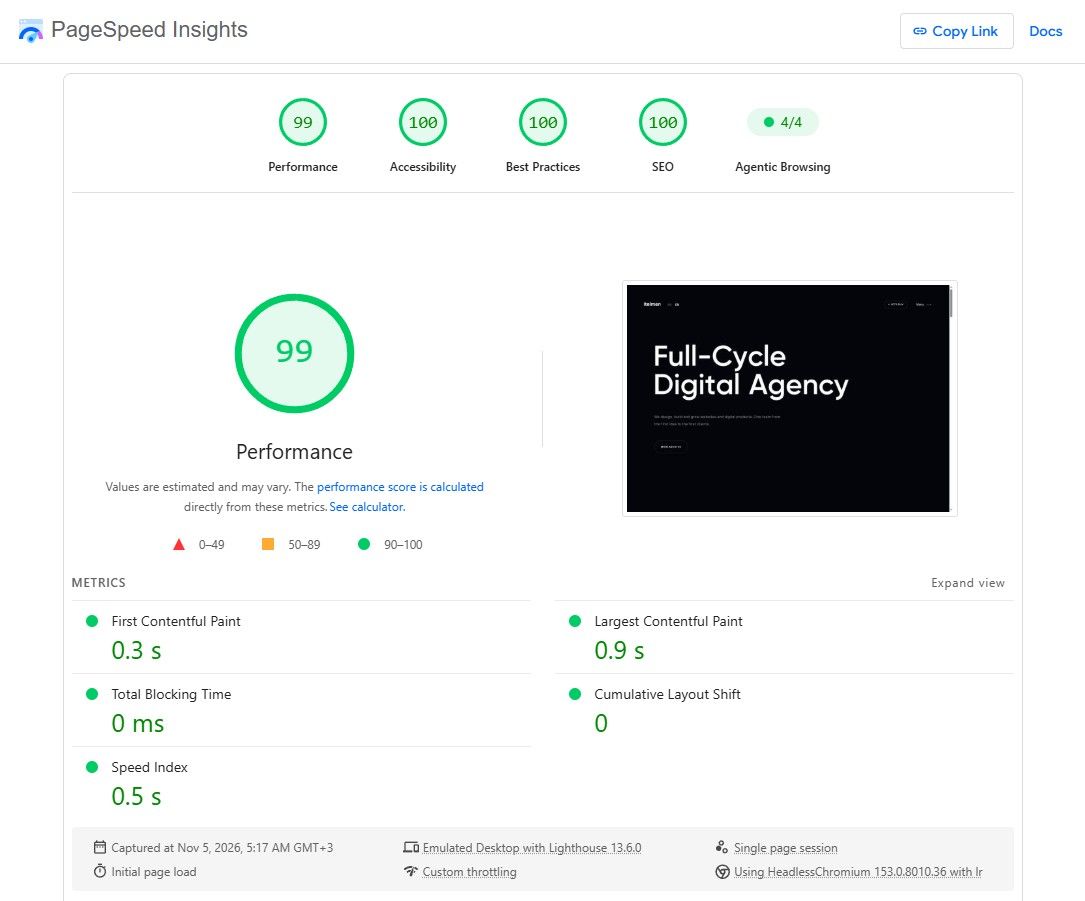
We started with our own: 99 on PageSpeed
Our website runs on Nuxt with WebGL scenes, video and animation on every screen. Sites like this are usually the heaviest to load, yet ours scores 99 for Performance on Google PageSpeed on desktop and 100 for Accessibility, Best Practices and SEO.
The main screen renders in 0.9 seconds, the layout doesn’t shift and Total Blocking Time is 0 ms. We use the same techniques on client websites.
All three metrics in the green
Google measures speed with three Core Web Vitals. Our goal: all three in the green, with measurements before and after.
- LCPMain screen loadedtargetGood ≤ 2.5 sNeeds improvementPoor
- INPResponse to a click or taptargetGood ≤ 200 msNeeds improvementPoor
- CLSLayout doesn’t jumptargetGood ≤ 0.1Needs improvementPoor
The essentials load first
We find what blocks rendering and send what’s visible right away first: the text, the main image and the first-screen styles.
Light images
AVIF and WebP sized to the screen. Images below the first screen load as you scroll.
Scripts stay out of the way
Chats, analytics and widgets load after the page, unused code goes. The page responds to clicks at once.
Fonts without jumps
Preloaded and sized up front, so the text doesn’t reflow.
A fast server
HTTP/2, compression and caching: repeat visits open almost instantly.
Why PageSpeed shows red
PageSpeed says 30–40 and it’s unclear which advice matters
We go through the PageSpeed and Lighthouse report item by item and estimate what brings the most points and seconds. We start with what blocks the first screen, not the minor items at the bottom.
We installed a caching plugin and the score barely moved
Caching speeds up the server response but doesn’t shrink what the browser loads. We cut unused scripts and styles, subset fonts and recompress images to AVIF and WebP.
Trackers, chat and widgets slow down every page
We defer analytics, chats and pixels until the first interaction or browser idle time. Analytics keeps collecting data while the first screen renders without it.
The page jumps while loading and buttons move under your finger
That’s CLS. We set sizes on images and banners and reserve space for fonts and late-loading blocks so the layout doesn’t shift.
Fast on desktop, but takes seconds to load on a phone
We measure on a slow phone over a mobile network, the way Google does. Phones get images at their size and skip what’s hidden on mobile.
Every second costs leads
- 8.4%more retail conversions when a mobile site got just 0.1 seconds fasterDeloitte & Google, 2020
- 53%of mobile visitors leave if a page takes longer than 3 seconds to loadGoogle, 2016
Fast, with the design intact
We speed up complex sites
Our own website with WebGL scenes and animations scores 99–100 on PageSpeed on desktop. We know how to keep the effect and still load fast.The cause, not a plugin
We find what exactly slows the site down and fix it in the code and server setup instead of adding one more plugin on top.Before and after
We record scores and Core Web Vitals before we start and show the same measurements after, page by page.No migration unless needed
We speed up the website on its current platform. We suggest a migration only when the platform itself won’t let it get faster.
Who needs speed optimization
A good fit if
- Mobile PageSpeed is below 50 and Search Console flags pages as slow
- Ads bring traffic, but some visitors leave before the page loads
- The site runs on WordPress or a custom stack and you’d rather not migrate yet
- Landing pages need to get fast before an ad campaign starts
Not a fit if
- The platform itself is the limit: then a move from WordPress to headless is the honest option
- The site needs a rebuild anyway: we’ll build speed into a new corporate website
- You only need to leave a slow host: we’ll help you move without a separate project
Express website audit
We review your site and within 3 business days send a PDF with up to 10 specific growth points, sorted by priority.
- Load speed and the mobile experience
- Structure, copy and the path to a lead
- Technical SEO and search visibility
- Forms, analytics and conversion tracking
For live websites only. No strings attached: you can make the fixes in-house.
How we work
- 01
Measurements
1–2 daysWe run PageSpeed, Lighthouse and Core Web Vitals field data for key pages on mobile and desktop.
You get A report with scores and the main bottlenecks - 02
Plan
1 dayWe rank fixes by impact: what brings the most points and seconds for the least effort.
You get A task list with expected impact and timing - 03
Optimization
1–3 weeksWe compress images, rework how fonts and scripts load and set up caching and CDN on a staging copy.
You get A faster website on a staging URL - 04
Review
1–2 daysWe measure again and check layout, forms and analytics against the original site.
You get A before and after comparison - 05
Launch and monitoring
1 dayWe deploy the changes and watch Core Web Vitals in Search Console. 3-month warranty on bugs.
You get A fast website in production with speed monitoring
What we need to start
- Access to hosting and the CMS or the site’s repository
- The pages that bring the most traffic and leads
- Access to Google Search Console for field data
- Which trackers, chats and widgets you actually need
- Integrations that must not break: forms, CRM, payments
Free speed audit
We run your key pages through PageSpeed for free and within 3 business days send up to 10 concrete fixes: what slows the site down and what brings the most points.
Related articles
All news


PageSpeed
in the red?
We’ll measure your key pages, find what slows them down and get the score into the green without touching the design.
For a typical website our target is 90+ on mobile and desktop. We name the exact number after the audit: it depends on the platform, the hosting and which third-party scripts you really need. If something stands in the way of 90, we’ll tell you upfront.
From $2,000. The total depends on the number of page templates, the platform and how many scripts and widgets need rework. We start with a free speed audit and send an estimate based on it.
PageSpeed Insights shows a Lighthouse lab run on an emulated phone plus real-visitor data from Chrome. Core Web Vitals are three metrics of real visits: how fast the first screen loads (LCP), how fast the page responds (INP) and how stable the layout is (CLS). Search cares more about those, so we improve both.
Page experience is one of Google’s ranking signals, but it works together with content and links. Its bigger effect is on behavior: fewer bounces and more leads from the same traffic.
WordPress usually speeds up well: the theme, plugins and server are in our hands. On Webflow and Framer part of the code belongs to the platform, so the ceiling is lower. If that isn’t enough, we’ll suggest a migration.
Yes. We optimize how the page loads, not how it looks, and compare the layout before and after so nothing breaks.
The PageSpeed lab score changes right after deployment. Core Web Vitals field data is collected over 28 days, so the Search Console report updates in about a month.
Related solutions
- WordPress to headlessKeep the familiar WordPress admin and move the website to a fast Nuxt front-end
- Tilda migrationWe move your website off Tilda to a custom stack: Zero Blocks, forms, catalog and SEO intact
- Webflow migrationWe move your website off Webflow: CMS collections, interactions and hosting under your control